Question
Basic syntax to create a bar-chart in R
isSolution
barplot(H, xlab, ylab, main, names.arg, col) where H is a vector or matrix which contains numeric values used in bar chart. xlab is the label for x axis. ylab is the label for y axis. main is the title of the bar chart. names.ar g is a vector of names appearing under each bar. col is used to give colours to the bars in the graph. Example : c(7,12,28,3,41) 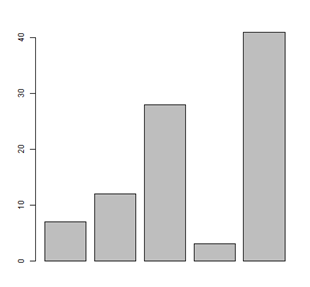
The book, “An Enquiry into the Nature and Causes of the Wealth of Nations”, (1776) defined Economics as:
Consider the following about Ayushman Bharat.
I. A health insurance scheme for providing free, quality and cashless health facilities in secondar...
Which of the following entities is responsible for implementing PMFBY at the state level?
During the TRAI meeting on 14th June 2024, what series was allocated exclusively for making transactional and service voice calls?
Which of the following is not published by Labour Bureau in the Ministry of Labour and Employment?
Consider the following Statements.
I. The primary objective of the RBI’s monetary policy is to maintain price stability while keeping in m...
CPI inflation in India (August 2025) was recorded at:
With which TV channel did the Indira Gandhi National Centre for the Arts (IGNCA) sign an agreement to make Indian art and culture more accessible?
Recently, which version of Pradhan Mantri Kaushal Vikas Yojana (PMKVY) has been launched in a bid to empower India’s youth with employable skills by m...
What can be the possible steps to prevent inflation?
I. Change the monetary policy.
II. Controlling the money supply.
III. Higher I...

