Question
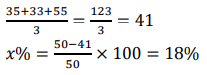
The given Bar Graph presents the number of different
types of vehicles (in lakhs) exported by a company during 2014 and 2015. The average number of type A, B and D vehicles exported in 2015 was x% less than the number of type E vehicles exported in 2014. What is the value of x ?Solution
RBI has signed an agreement for currency swap facility under SAARC currency swap Framework with which of the following countries?
Who presides over the joint session of the Indian Parliament?
The Union Cabinet has approved a last-mile broadband connectivity plan for 6.4 lakh villages across the country under the BharatNet project with an outl...
The Reserve Bank of India (RBI) recently raised the limit for tax payments via UPI. What is the new transaction limit for these payments, and what addit...
Under SIDBI's Mission 50K - EV4ECO, how many electric 3 - wheelers ( E3W ) will be deployed in Hyderabad and Delhi by ETO Motors with the granted financ...
How many individuals were selected for Padma Awards in 2024 across both civil investiture ceremonies?
The analog Moon mission in which Aditya Pandya participated was conducted at:
Which of the following tools is used in Gram Panchayat governance to summarize meetings in 14 Indian languages?
Consider the following statements about Allied Climate Partners (ACP):
1. At COP28, ACP joined International Finance Corporation in a cli...
Which team won the Women's Junior Hockey Asia Cup 2023 title?
Relevant for Exams:

