


Question
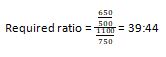
What is the ratio of water consumption per consumer in 2014 to the same in 2017?
The graph suggests the no. of consumers and usage of water of units in five years. Read the graph and answer the question. Total number of consumers are given in (thousand) and usage of water is given in (lacs).
More Di Bar Graph Questions
- What is the difference between the sales of Nike in Chandigarh and that in Bhopal?
- The total number of total employees working in Emirates is approximately what percent more or less than that of Jet Airways?
- By what per cent should the sales of Santro be increased so that its sales volume in Maharashtra becomes 18000, while in all other states remaining the sam...
- The given histogram represents the frequency distribution of average runs scored by 50 selected players from a district in a local cricket tournament. Wh...
- In which of the following years is the profit of the Airlines the maximum?
- What is the difference between the sales of Santro in Uttrakhand and that in Haryana?( in thousand units)
- In which of the following year, the ratio of unit consumption to the no. of consumers is maximum?
- What was the difference between the number of petrol cars in perfect conditions of Hyundai & that of Ford?
- What is the different between the sales of Santro in Uttrakhand and that in Haryana?( in thousand units)
- If total sales of shoes of all brands together increases by 15% in 2018 and the sales of Nike in Nasik increases by 10% keeping percentage distribution of ...
Relevant for Exams:
Hey! Ask a query
Please enter email id
The email must be a valid email address.
Please enter Mobile Number
Please enter valid Mobile Number
Please enter your Doubt

Think You're Ready for RBI Grade B?
RBI Grade B 2026 Phase 1 Memory Based Paper
- 200 Questions with Detailed Solutions
- Section-wise Coverage (GA, English, Quant & Reasoning)