Question
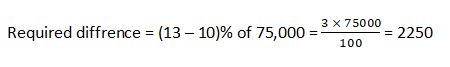
What is the different between the sales of Santro in
Uttrakhand and that in Haryana?( in thousand units) Study the following bar graph and pie-chart and answer the questions given below: The bar graph shows the sales of six different brands of cars manufactures in 2017(in thousand) in India. The pie-chart shows the percentage sales of Santro in 2017 in different states of India.Solution
A boat can cover 140 km in downstream in 14 hours and 96 km in upstream in 12 hours. Find the distance travelled by the boat in still water in 5 hours.
A boat covers 13 km upstream in 52 min. If the speed of the current is 3 km / h, then in how much time will it cover 40 km downstream?
The downstream speed of a boat is 6 km/hr more than its upstream speed and the ratio of the speed of the boat in still water to the speed of the stream ...
A boat moves upstream at 18 km/hr. If it covers 270 km downstream in 5 hours, determine the speed of the current.
Speed of a boat in still water to speed of boat in upstream is 7:4. If the boat can travel 450 km in downstream in 5 hours, then find the time taken by ...
The speed of a boat in still water is 6 km/hr and speed of current is 4 km/hr. If time taken to cover a certain distance upstream is 10 hours, then how ...
- A boat travels 100 km upstream and 160 km downstream in 9 hours. If the speed of the boat in still water is 25 km/hr greater than the speed of the stream, ...
The ratio of the speed of a boat in downstream and speed of the stream is 7:2. If the speed of the current is 4 km/hr, then find the distance travelled ...
- The ratio of the boat's speed in still water to the speed of the stream is given as 12:1. The boat takes a total time in the ratio 13:9 to travel (d + 48) ...
A boat can travel 15 km upstream and 21 km downstream in 3 hours. Find the speed of the boat in still water if the speed of the stream is 1.5 km/h.
Relevant for Exams:

