Question
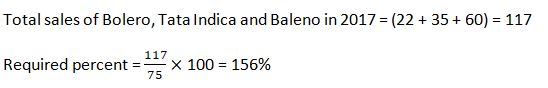
The total sales of Bolero, Tata Indica and Baleno
together in 2017 is approximately what per cent of the total sales of Santro in all states together in 2017? Study the following bar graph and pie-chart and answer the questions given below: The bar graph shows the sales of six different brands of cars manufactures in 2017(in thousand) in India. The pie-chart shows the percentage sales of Santro in 2017 in different states of India.Solution
More Di Bar Graph Questions
निम्नलिखित रिक्त स्थान में उचित शब्द भरिए–
“ अधिकारि�...
निम्नलिखित रिक्त स्थान में उचित शब्द भरिए–
यदि प्रशास...
निम्नलिखित प्रश्न में रिक्त स्थान के लिए सही ‘भाववाचक सं�...
मानव शरीर में पोषक तत्वों की कमी का प्रभाव धीरे-धीरे __________ र�...
कोष्ठक में दिए गए शब्द का सही पर्यायवाची चुनिए।
अचानक �...
यह महामारी हमें कितना नुकसान पहुंचा सकती है, यह हमारे हाथ �...
दिए गए वाक्यों में रिक्त स्थानों की उचित शब्दों द्वार...
रिक्त स्थान के लिए उपयुक्त भाववाचक संज्ञा का चयन कीजिए।
निम्नलिखित प्रश्न में , चार विकल्पों में से , उस सही विकल्प...
किसी भी नीति की सफलता उसके __________ क्रियान्वयन पर निर्भर करती...
Relevant for Exams:

