Question
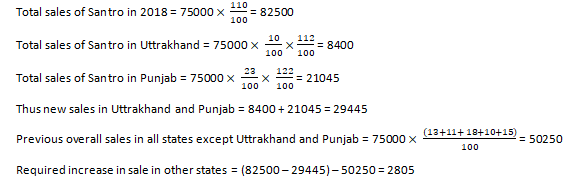
If in 2018, the total sales of Santro increased by 10%
while its sales in Uttrakhand increased by 12% and that in Punjab increased by 22% then what is the increased in sales in the rest of the states? Study the following bar graph and pie-chart and answer the questions given below: The bar graph shows the sales of six different brands of cars manufactures in 2017(in thousand) in India. The pie-chart shows the percentage sales of Santro in 2017 in different states of India.Solution
- Which firewall type inspects packets at all layers of the OSI model to ensure complete protection?
State True/False
With a data mart, teams can access data and gain insights faster, because they don’t have to spend time searching within a ...
What will be the output of the following code snippet implementing the Least Recently Used (LRU) page replacement algorithm?
def lru(pages, capac...
Size of MD5 message digest
- Which attack type specifically targets application-layer protocols like HTTP, DNS, and SMTP?
Data Analytics uses ___ to get insights from data.
What is the purpose of the with statement when working with files?
Which of the following algorithm design techniques is characterized by breaking a problem into smaller sub-problems and solving each recursively? �...
Which of the following data structures is best suited for implementing a priority queue?
Which file structure allows for efficient retrieval of data using a hierarchical model?
Relevant for Exams:

