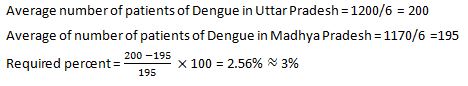
The average number of patients of Dengue in Uttar Pradesh in all the given years is approximately what percent more or less than the average of the number of patients of Dengue in Madhya Pradesh in all the year given years?
Which of the following is best suited as catch crop?
Model plants concept given by Donald is known as
Objectionable weed in wheat field is _____
Growing of two or more crops simultaneously intermingled without any specific row pattern is known as:
Dihybrid ratio 9:3:3:1 in F2 results due to independent assortment of :
Which variety of rice is tolerant to iron toxicity
ICAR- Indian Institute of Rice Research is situated at
Which of the following Scientist discovered the element Potassium?
Family of sesame is
Mango Is an example of