Question
If average number of employees in department A in years
2016, 2018 & 2019 is 175, then find the total number of employees in department A in years 2019? Study the following graph carefully and answer the given questions: The line graph given below shows the number of total employees (Male and Female) in two different departments of a company in three different years i.e. 2016, 2018 and 2020.Solution
Let number of employees in department A in year 2019 be x. According to question, => 120 + 180 + x = 175 × 3 => 300 + x = 525 => x = 225 Total number of employees in department A in years 2019 is 225.

A number is increased by 20% then reduced by 20%. If final value is 144, find original number.
Find the difference between minimum and maximum value of 'i' such that '8i2470' is always divisible by 3.
If the numerator of a fraction is increased by 200% and the denominator is increased by 400%, the resultant fraction is 9/25 . What was the original fra...
Find the greatest 4-digit number which is exactly divisible by 12, 15 and 18.
When a least four-digit number 'x' is divided by 120, 100, and 80, it leaves a remainder of 15 in each case. What least number must be added to 'x' so t...
Rs 720 is to be divided among P, Q and R so that P gets 3/5 of Q’s share and R gets 1/3 of P’s share. Share of R is:
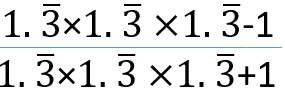
find the value of this?
How many 4-digit numbers greater than 3000 can be formed using the digits 1, 2, 3, 4, 5 without repetition?
Relevant for Exams:

