
Get Started with ixamBee
Start learning 50% faster. Sign in now
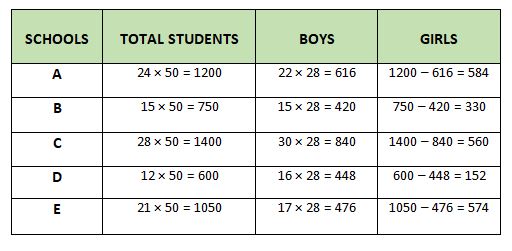 Required average = (1/3) × [(30+16+17)/100] × 2800 = 588
The 32nd edition of the India-Thailand Coordinated Patrol (Indo-Thai CORPAT) between the Indian Navy and the Royal Thai Navy is being conducted from ___...
Which space organization recently announced ‘DRACO Mission’ to study satellite disintegration phenomenon?
What was the percentage growth in India’s coal output for the fiscal year ending in September 2024?
Indirasagar Dam is situated in which Indian state?
Which type of material does 'oiled paper' exemplify?
Which of these statements correctly describe the state of horticulture in India during 2022-23?
(I) India's horticulture production in 2022-23 is...
The Vedic outlook of an individual and his relation to the society is determined by the four aims of life. Which of the following is not one of these ob...
With reference to Mangroves, consider the following statements:
1. Mangrove forest usually grow only at Tropical and Subtropical latitudes near e...
In case of Forward Rate Agreement there is an exchange of interest rate
Arrange the following countries, as largest countries by Area in the chronological order from highest to lowest in terms of the area.
A. Ind...
