
Get Started with ixamBee
Start learning 50% faster. Sign in now
The logic followed here is as follows: In first three diagrams from the left end, we observe that corners of larger figure is increasing by one and the number of lines inside the larger figure is increasing by one in each step. 
In the basic Solow model of growth
Production function of two companies producing floppy and discs was given.
Q1 = 10L^0.5 K^0.5 Q2 = 10L^0.6K^0.4
Which of the following i...
In a perfectly competitive market, a firm’s long run supply curve is
Weighted least square is the Remedial measure for which of the following?
Let the correlation coefficient between X and Y be 0.6. Random variables Z and W are defined as Z=X+5 and W=Y/3. What is the correlation coefficient bet...
If a random variable X follows a uniform distribution between 0 and 1, what is the expected value of X?
An indirect utility function
A firm sells 40 units of commodity X when its price is 10. At what price it will sell 60 units of the commodity if its price elasticity of supply is 0....
Mahalanobis model is –
Consider a bargaining game:
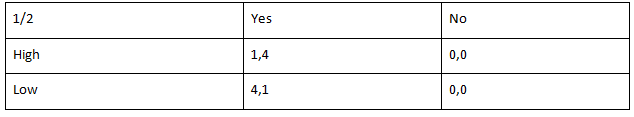
Find pure strategy Nash equilibrium.
