Question
How is M related to
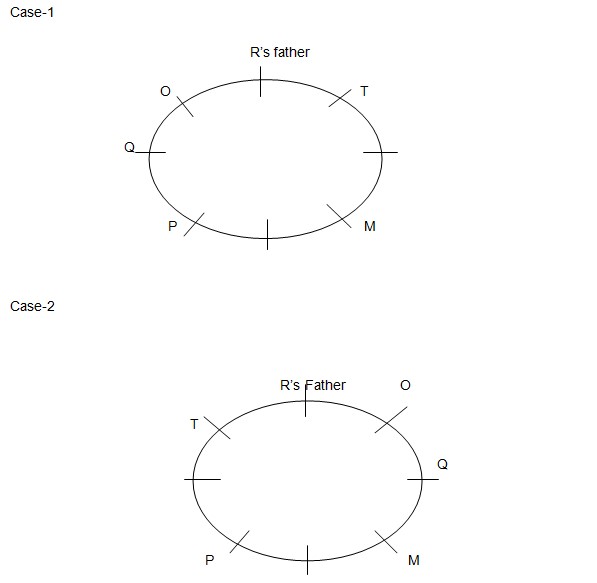
T? Study the following information carefully and answer the question below- There is a family of eight people M, N, O, P, Q, R, S and T and are sitting around a circular table facing to the centre. There are three married couples in the family. They are from three generations. None of the member of the third generation is married. They are of different age but their ages are in descending order according to their generation such as Grandfather is the eldest, grandmother is the second eldest, son is the third eldest, daughter- in – law is the fourth eldest, son – in – law is the fifth eldest, daughter is the sixth eldest, grandson is the seventh eldest and granddaughter is the eighth eldest. The person who sits immediate right of T is a male but he is not S. Q who is sitting next to O is not sitting opposite to M. Only the father of R is sitting between O and T. O is the female member of the family. T’s age is 2 year less than M’s age and M’s age is 6 year less than Q’s age. S’s age is multiple of 4 but not a perfect square. P is the mother of Q and her age is 2.5 of the age of her son. P is 4 year younger than N. The age of the second eldest person is 70 year. T is the brother – in – law of M. N does not sit opposite to the second youngest person. R does not belong to third generation. R has no child. The person who is sitting on the immediate left of M and immediate right of P is 18 years old while O is 10 year old.Solution
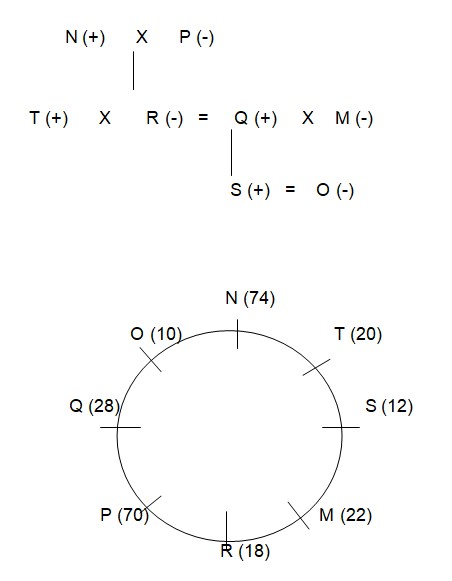
The age of the second eldest person is 70 year which means the age of the grandmother is 70 year. T is the brother – in- law of M. T’s age is 2 year less than M’s age and M’s age is 6 year less than Q’s age. P is the mother of Q and her age is 2.5 of the age of her son. From these it is clear that M, T and Q belongs to second generation and P is the grandmother whose age is 70 year. Further, only the father of R is sitting between O and T. R does not belong to third generation. So, R belongs to second generation. The person who is sitting on the immediate left of M and immediate right of P is 18 year old while O is 10 year old. Q, who is sitting next to O, is not sitting opposite to M.  O is the female member of the family. O is 10 year old. So, O is the granddaughter and 10 year old. P is 4 year younger than N. Means N is 74 year old. Rest S’s age is multiple of 4 but not a perfect square. As only remaining position is that S is the grandson and is 12 year old. The person who sits immediate right of T is a male but he is not S.. As we know that S can’t sit between P and M, so clearly R sit between P and M and S can’t sit to immediate right of O so from this case 2 will be eliminated. Rest we know that the age of R is 18 year so she is the daughter of N and Q is the son of P and is 28 year old. Rest T is 20 year old, M is 22 year old, M is 22 year old. So, the final arrangement is –
Top working in old plants is done
Vertisol order soil is found maximum in which state?
Detasseling is done in maize to ______
Auxin is:
Which of the following statement is incorrect for Cyclones?
A _______mutation originates during meiosis while a _______ mutation originates during mitosis.
The flavor of ripened banana is due to which compound
C/ N ratio of paddy straw, in general, is:
Which honey bee species is characterized by its migratory behavior, forming large colonies and often nesting in cavities such as tree hollows?
The F1 progeny of a cross is


