Question
What is the position of R with respect to the one who
sits to the immediate right of W? Study the following information carefully and answer the questions given below. Eight persons P, Q, R, S, T, U, V and W are sitting in straight line. Some of them are facing north while some of the facing south but not necessarily in the same order. V sits at one of the extreme ends of the line. Only three persons sit between U and V. P sits second to the right of U. Both R and Q are facing the same direction. S faces north. T sits to the immediate right of V. R sits third to the right of Q. Both U and T face the same direction as P. Only three persons sit between S and W. U sits to the immediate left of S. W is not facing the same direction as V. Both the immediate neighbors of S face opposite directions.Solution
V sits at one of the extreme ends of the line. Only three persons sit between U and V. T sits to the immediate right of V. U sits to the immediate left of S. S faces north. 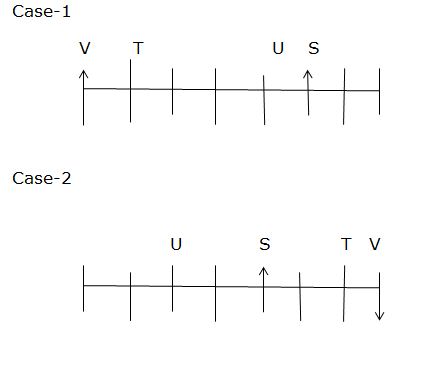 Only three persons sit between S and W. W is not facing the same direction as V. R sits third to the right of Q. Both R and Q are facing the same direction. P sits second to the right of U. Both the immediate neighbors of S face opposite directions. Both U and T face the same direction as P. Hence, case 1 gets eliminated.
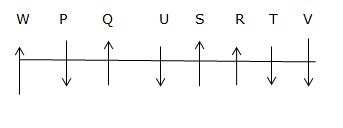
Which of the following is not a measure of central tendency?
In which scenario is stratified sampling most suitable?
What differentiates big data from traditional data in terms of its defining characteristics?
Which data collection method is best suited for obtaining real-time data from a third-party application?
In time series forecasting, what is the primary role of the ARIMA model ?
Which data modeling technique is used to represent the relationships between entities in a database?
Which of the following scenarios is best suited for web scraping as a data collection method?
Which of the following methods is used to ensure stationarity in time series data, a critical prerequisite for ARIMA modeling?
Which of the following Python libraries is most appropriate for creating statistical visualizations such as violin plots and heatmaps?
When identifying business problems, what is the first step a data analyst should take to ensure clarity and effectiveness in solving the problem?
Relevant for Exams:

