
Get Started with ixamBee
Start learning 50% faster. Sign in now
Some graphs are data(I) + Some data are details(I) ⇒ No conclusion. Hence, conclusion I does not follow. All charts are graphs(A) + Some graphs are data(I) ⇒ No conclusion. Hence, conclusion II does not follow. Some graphs are data(I) ⇒ Conversion ⇒ Some data are graphs(I). Hence, conclusion III does not follow. ALTERNATE METHOD: 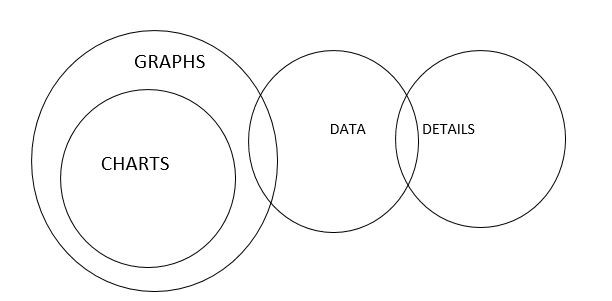
As per the Indiana Discrimination Report 2022, the Labour Force Participation Rate (LFPR) of women in India is just ____ percent in 2021.
As per the Constitution of India, which of the following items is NOT correctly matched ?
Around which year did Robert Brown publish a paper highlighting the presence of a nucleus in plant cells?
The________secrete(s) bile in human digestive system.
What is the revised maximum increased project cost, in lakh rupees, for manufacturing units under the Prime Minister's Employment Generation Programme, ...
The famous Begumpuri mosque, built in the Tughluq period, is located in __________.
Which companies still account for 80% of transactions, despite the allowance for new players to scale payments services to 100 million users?
In Vaishnavism, how many avatars or incarnation of deity were recognised?
____________ is an order or order given by a superior court to a subordinate court or tribunal or public authority if it is not discharging its duty.
To whom does the Public Accounts Committee submit its report?
